

According to NHTSA figures, 39,254 people died in traffic crashes in 2024. Nonetheless, millions of drivers navigate American roads every day without fully appreciating the extent of road risk, or realizing the varying threat levels different times of day represent.
This study will pinpoint the most dangerous periods on U.S. roads. We’ll consider the most dangerous commute times, and the specific hours and days that see the highest number of crashes each year. We’ll also clarify which drivers are most at risk on American roads.
First, let’s look at the specific times of day that represent the highest danger levels for drivers.
The Deadliest Hours on America’s Roads
In 2024, U.S. roads were subject to 36,297 fatal motor vehicle crashes that claimed 39,254 lives. Yet those crash and fatality numbers were unevenly distributed across the hours of the day. When we focus on the data, a troubling pattern is clear: while all hours on American roads involve some level of risk, some periods are specifically dangerous.
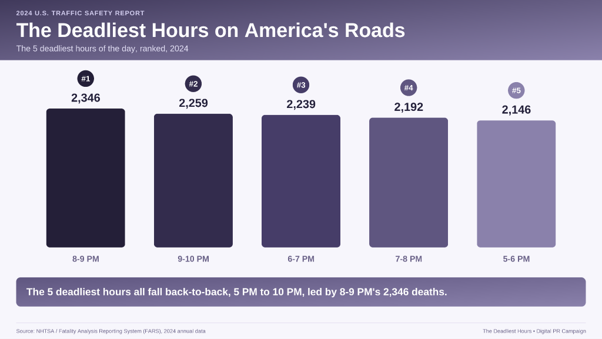
The most dangerous period of the day runs from 5 pm to 9 pm. During those four hours, 23% of the day’s crashes occur. In 2024, that meant 8,340 fatal crashes that killed 8,923 people.
If we widen our time period, we can see that nearly one in three traffic deaths in 2024 (12,908 of 39,254) happened during the six hours between 6 pm and midnight, a window that accounts for just 25% of the day. If we adjust our focus to between 5 pm and 11 pm, the six-hour period now accounts for 13,220 deaths, 34% of the year’s total.
If we compare that to the six-hour span during the early morning (12 am to 6 am), the fatality total is 8,063 deaths. That’s 39% fewer, despite the same time period.
The single deadliest hour of the day was 8 pm to 8:59 pm, which saw 2,195 fatal crashes and 2,346 deaths. The 9 pm to 9:59 pm and 6 pm to 6:59 pm hours followed closely behind, each logging over 2,100 fatal crashes and over 2,200 deaths.
Conversely, the calmest hour on record was between 4 am and 4:59 am, a period that featured just 950 fatal crashes and 1,029 deaths, less than half the number recorded during the evening peak. Even if we account for lighter overnight traffic, the gap is striking: by 8 pm, drivers face over double the fatal-crash risk of the pre-dawn hours.
The disparity remains when we compare rush hour periods. The morning commute window (7–9 am) was subject to 2,102 fatal crashes and 2,274 deaths; the evening commute window (7–9 pm) saw almost double that rate (4,244 fatal crashes and 4,538 deaths).
The risk levels begin to sharply rise during the afternoon period. The 3–6 pm window averages 1,985 deaths per hour, 75% higher than the 1,137 deaths-per-hour rate recorded over the morning commute.
Midday hours (9 am–3 pm) are relatively sedate by comparison, with 8,443 deaths recorded across the six-hour period.
Overall, the data is clear: likely due to a combination of fatigue, darker roads, higher speeds, higher levels of alcohol involvement and distraction, the drive home is measurably more dangerous than the drive to work.
The Most Dangerous Driving Hour: A Shifting Phenomenon
The most dangerous driving hour shifts across the yearly calendar. According to a National Safety Council analysis of NHTSA’s FARS and CRSS data, while fatal crashes peak between a 4 pm and midnight window, exactly where within that eight-hour window the most dangerous hour falls evolves from season to season.
During spring and summer, when daylight hours stretch long into the evening, the fatal-crash peak occurs between 8 pm and 11:59 pm, aligned with this campaign’s broad data discoveries. Yet it’s important to emphasize the fact that, between November and February, the peak shifts to nearly four hours earlier, between 4 pm and 7:59 pm, when early winter darkness overlaps with the daily commute.
Overall, the answer to which driving hour is the most dangerous isn’t a fixed point: it’s a shifting window that arrives early in December and late in July.
Far more definitive is the fact that nights over the weekend represent the key danger period for U.S. drivers.
The Weekend Nighttime Risk Window
If we closely consider 2024’s 36,297 fatal crashes by day and hour, a clear, unchanging pattern emerges: drivers face most danger during weekend nights.
Saturday is the deadliest day of the week. Its 6,218 fatal crashes represent about 17% of the annual total. Not too far behind are Sunday (5,597) and Friday (5,588). Tuesday was the safest day (4,543 fatal crashes), with a fatal crash 37% more likely to occur on Saturday than Tuesday.
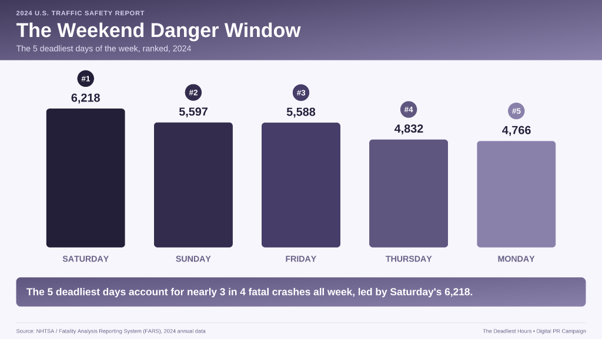
The weekend period (Friday through Sunday) accounted for 17,403 fatal crashes, around 48% of the yearly total. That means just three days featured almost half of all crashes. By comparison, the four-day window featuring Monday to Thursday accounted for 52% of all crashes.
Beyond the single riskiest hour (Saturday between 8 pm and 8:59 pm, 420 fatal crashes), other hours featuring the highest levels of risk all occurred during the same weekend period: Saturday between 11 pm and 11:59 pm (414), Saturday between 9 pm and 9:59 pm (394), Saturday between 10 pm and 10:59 pm (390), Friday between 9 pm and 9:59 pm (386), and Sunday between 2 am and 2:59 am (381).
The trend becomes emphatically clear when we consider the 20 most dangerous hours of the year. 18 of these occurred between Friday evening and early Sunday morning, with eight on Saturday. Only one weekday evening hour (Thursday between 7 pm and 7:59 pm) appeared in the top 20.
Friday and Saturday night data reveals different risk patterns. Friday road risk steadily builds during the evening, peaking at 9 pm before tailing off. Saturday features two separate peaks: one at 8 pm, and another at 11 pm, a pattern that’s consistent with two separate waves of late-night activity.
Between Friday 6 pm and Sunday 3 am (a 33-hour window), the U.S. recorded 9,395 fatal crashes, nearly 26% of the year’s total despite covering less than 20% of the week’s hours. Friday nights featured 38% more fatal crashes than average weekday evenings, while Saturday night figures were even higher (50%).
The late-night differential is equally notable. Between Monday and Thursday (midnight to 3 am), the average nightly number of fatal crashes was 429, far less than on Saturday (994) and Sunday (1,080). The Sunday spike largely reflects Saturday night activity overlapping with early Sunday morning.
The safest period was Tuesday and Wednesday between 3 am and 3:59 am, each featuring 86 fatal crashes, around a fifth of the number recorded during the Saturday night peak hour.
Overall, fatal crash risk isn’t restricted to traditional commuting hours. It’s most heavily prevalent during Friday, Saturday and parts of Sunday, when weekend travel, nightlife and impaired driving combine.
Fatal Crashes vs. Injury Crashes: A Risk-Factor Distinction
Fatal and nonfatal crashes follow different patterns. While the fatal crash risk is highest over the late-night period on weekends, according to the National Safety Council’s analysis of 2024 NHTSA data, injury crashes occur more often on weekdays, peaking on Friday. The key nonfatal crash time period is between 4 pm and 7:59 pm during the evening commute.
As such, any effective safety campaign would require a dual-focus that makes it clear: everyday commuting features the highest risk of injury, while late-night weekend driving represents the highest risk of a road fatality.
When we consider crash risk, it’s also worth looking at the causes of crashes, with driver behavior a crucial determining part of the equation.
Key Crash Behavioral Factors
Alcohol remains the key nighttime driver risk factor. Nearly 30% of 2024’s traffic deaths (11,904 people) featured a driver with a BAC of .08 or higher, while 20.4% involved a driver at .15 or above. Alcohol’s role in car crashes steadily rises throughout the evening, increasing from 28% at 6 pm to peak at 61% by 2 am.
The window between midnight and 3 am averaged 56% of crashes featuring alcohol impairment, compared with only 12.5% between 9 am and 3 pm. Those three overnight hours alone accounted for 2,603 deaths, around one in every fifteen traffic fatalities.
Speeding follows a similar pattern, contributing to 31% of fatal crashes overall, with a 39.7% involvement in overnight crash deaths compared with 28.1% during midday. Unlike alcohol, speeding represents a significant level of risk throughout the day, yet risk peaks (40.6%) at the same time impairment risk peaks (2 am), creating a highly dangerous overlap.
Road accidents and fatalities due to distracted drivers follow a very different pattern. While distraction is a factor in 8.8% of all fatal crashes, its involvement peaks during daylight hours as opposed to at night. Crashes due to distraction remain consistently high between 10 am and 3 pm, peaking at noon (11.6%).
Late-night distraction crash levels average around 8%: the data suggests that this factor is chiefly a daytime risk tied to commuting, school travel and casual journeys.
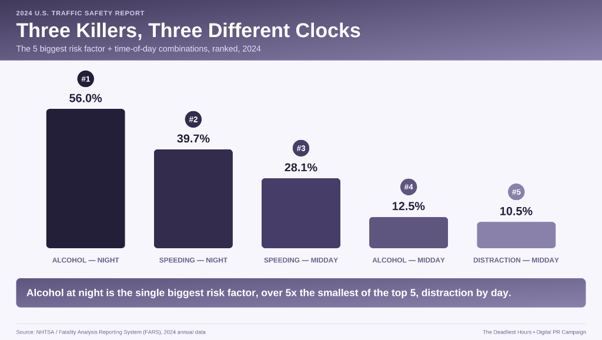
Combined, the data confirms that traffic risk related to driver behavior follows three different patterns: alcohol involvement peaks overnight, distraction dominates the daytime, and speeding, while consistent through the day, is most dangerous when overlapping with nighttime drunk driving.
So, the highest-risk period is not defined by a single factor but by multiple combined risks (especially between Saturday night and early Sunday morning).
NHTSA’s 2024 data shows that dangerous driving behaviors often overlap. 43% of 41,912 passenger-vehicle drivers involved in fatal crashes engaged in at least one key dangerous driver behavior. Yet 1,565 drivers (3.7%) engaged in all three simultaneously, meaning that one in 27 fatal-crash drivers was impaired, speeding, and failed to use their seat belt.
The failure to use a seat belt often compounds the risk of a crash fatality. 56% of people killed in nighttime crashes were not using their seat belt, compared with 41% of road fatalities that occurred during the daytime. The data suggests that nighttime crashes are especially deadly due to the combination of dangerous factors (alcohol, speeding, and a lack of seat belt use).
Who’s Most at Risk of a Fatal Crash?
U.S. road deaths in 2024 primarily affected men (28,385 of 39,254 fatalities, or 72.3%) as opposed to females (10,764, 27.7%). The gap widened after dark, with men representing around 75% of deaths between midnight and 3 am, compared with around 68% during midday.
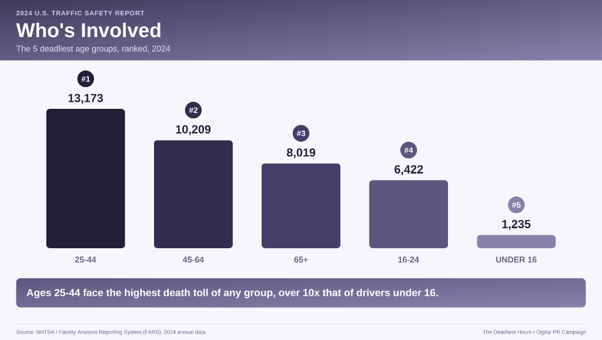
Age patterns confirm an additional risk layer. Adults aged between 25 and 34 were subject to the highest number of deaths (6,921), followed by those aged between 35 and 44 (6,252). Together, both groups (25-44 year-olds) accounted for 13,173 fatalities, around a third of all traffic deaths. Drivers aged between 16 and 24 accounted for another 6,422 deaths (16.4%), despite representing a much smaller share of licensed drivers.
The period that represented the highest amount of road death danger differs sharply depending on a person’s age. Drivers aged between 16 and 20 were most vulnerable between midnight and 1 am (suffering 215 deaths during that single hour), reflecting risks associated with nighttime driving, impairment and speeding. Speed was a key factor in 47.4% of teen fatalities, the highest of any age group, whereas alcohol was a factor in 31%.
For older drivers, the data is very different. Danger for drivers aged 75 and older peaked between 1 and 2 pm (354 deaths), reflecting their daytime routine. 75+ crashes involved the lowest alcohol (13%) and speeding (14.1%) rates.
Deaths due to alcohol and speeding clearly decline as drivers age. Drivers dying due to alcohol impairment peaks with a rate of 41% among those aged between 21 and 34 before steadily falling to 13% among drivers aged 75+.
Drivers dying due to speeding peaks at 47.4% among those aged between 16 and 20 before tailing off to 14.1% among older drivers. Distraction differs: deaths due to this factor remain relatively stable throughout adulthood before rising among older drivers.
The data confirms that traffic risk is complex. Both a Saturday night crash involving a young driver due to speed and impairment and a weekday afternoon crash involving an older driver reflect very different circumstances and contributory factors.
Chicago Road Risk Assessed
Chicago’s 2024 traffic data provides a useful guide to driver danger in the city, which recorded 130 traffic deaths. May was the deadliest month: it featured 16 deaths (12% of the annual total) plus the highest number of pedestrian deaths.
In 64% of pedestrian fatality cases, a larger vehicle such as an SUV, pickup truck, or van was involved. Among hit-and-run pedestrian deaths, the highest proportion of drivers were aged between 20 and 30 (a statistic in alignment with national data).
The severest Chicago crashes involved right-angle collisions (24%) and turning crashes (21%), while 14% of fatal crashes occurred during rush hour.
Most serious crashes took place in the Central Business District and South and West Sides; those areas were also subject to major road safety improvements, including an 18.5% reduction in deaths and serious injuries between 2021 and 2024 and similar improvements to several West Side communities.
Chicago-centric data reinforces broader findings: traffic risk depends on the driver, the time they’re behind the wheel, and the circumstances that surround the crash.
Seasonal Variation in Traffic Risk
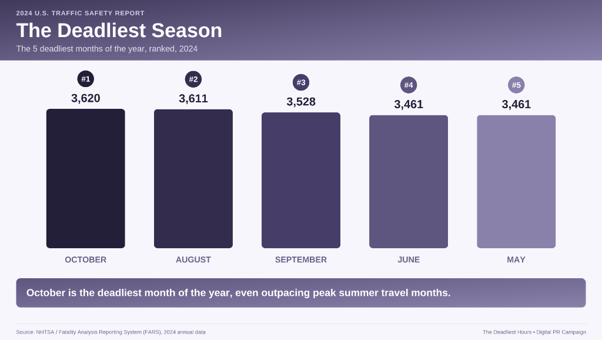
October was 2024’s deadliest month for traffic fatalities: its 3,620 deaths (9.2% of the annual total) narrowly surpassed August (3,611) and September (3,528) figures.
February recorded the fewest deaths (2,710, 6.9%). Even if we factor in February’s shorter length, October averaged 116.8 deaths per day compared with 93.4 in February, meaning an October day was around 25% more dangerous.
Seasonal patterns reinforce this trend. Summer (June to August) averaged 113.5 deaths a day, compared with 94.5 during winter (December to February), reflecting a higher volume of traffic and more vacations. That said, October’s peak exceeded any point during the summer.
This is largely attributed to factors such as abruptly shorter daylight hours before the clocks are changed, harvest and hunting travel, back-to-school traffic and Halloween pedestrian activity.
Every age group was subject to more fatalities during October than in other months: the increases ranged from 3% among those aged between 16 and 20, 17% among those aged between 55 and 64 and 14% among those aged 75 and older.
Teen drivers were subject to a different seasonal pattern. Drivers aged between 16 and 20 recorded their highest fatalities in June (351 deaths), with 30.5% of annual deaths occurring between June and August (compared with 26.6% for the overall population).
This aligns with the ‘100 Deadliest Days,’ the oft-referenced period between Memorial Day and Labor Day when teens spend most of their time on the road. By contrast, adults aged 75 and older adhered to the broader population pattern, peaking in October rather than during the summer.
The prevalence of contributing factors also shifted throughout the year. Alcohol involvement remained relatively stable (between 29% and 33%) while peaking in June, whereas speeding peaked in May (33.4%) before reaching its annual low in November.
Distracted driving showed the clearest seasonal pattern: rising to 9.8% of fatal crashes in September (during the back-to-school period) before falling to 7.3% in January.
Overall, the data emphasizes the fact that crash risk is shaped by numerous factors (the time of day, the day of the week, a driver’s age, and the yearly season) as opposed to any single factor. And yet, October emerges as the most consistently dangerous month across all combined measures.
Traffic Fatality Patterns Can Help Targeted Enforcement And Safety Campaigns
In 2024 on U.S. roads, there were 36,297 fatal crashes and 39,254 fatalities, with risk concentrated during specific times as opposed to evenly distributed.
The most dangerous period (5-9 pm) accounted for nearly 9,000 deaths, while almost a third of all fatalities occurred between 6 pm and midnight. The deadliest single hour was 8-9 pm, with 4-5 am the safest. Evening commutes proved far deadlier than the morning equivalent, featuring nearly twice as many fatal crashes.
Weekend nights posed the greatest danger, with Saturday the deadliest day; Friday to Sunday accounted for nearly half of all fatal crashes. The highest-risk hour was Saturday between 8 and 9 pm, with most of the year’s most dangerous hours occurring between Friday evening and early Sunday morning.
The single deadliest hour of the day was 8 pm to 8:59 pm, which saw 2,195 fatal crashes and 2,346 deaths.
Driver behavior followed distinct patterns. Alcohol impairment peaked overnight, contributing to 61% of fatal crashes at 2 am. Speeding also peaked late at night; distraction was most common during daytime commuting hours. These risks often overlapped, with impaired, speeding, and unbelted drivers disproportionately involved in fatal crashes.
Men accounted for 72% of fatalities, while adults aged between 25 and 44 represented a third of all deaths. Teen fatalities peaked at night, older-driver deaths peaked during the afternoon, while October was the deadliest month, highlighting how crash risk varies by hour, day, season, age and behavior rather than due to any single factor.
Ultimately, effective safety campaigns must address these distinct risk profiles. The data featured in this report clearly underscores the factors and periods that demand the most attention. As such, it represents a potentially highly useful resource not only for those addressing road safety from an educational standpoint but also from an enforcement standpoint.
A serious car accident can have a devastating effect on your life. At Postman Law, our car accident lawyers help injury victims take control of their case and their recovery. Whether you were rear-ended, T-boned, hit by a distracted driver, or injured in a rideshare accident, our experienced legal team is here to fight for you so you receive full and fair compensation.
You focus on healing. We’ll handle everything else.